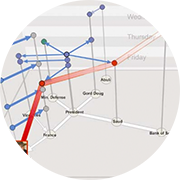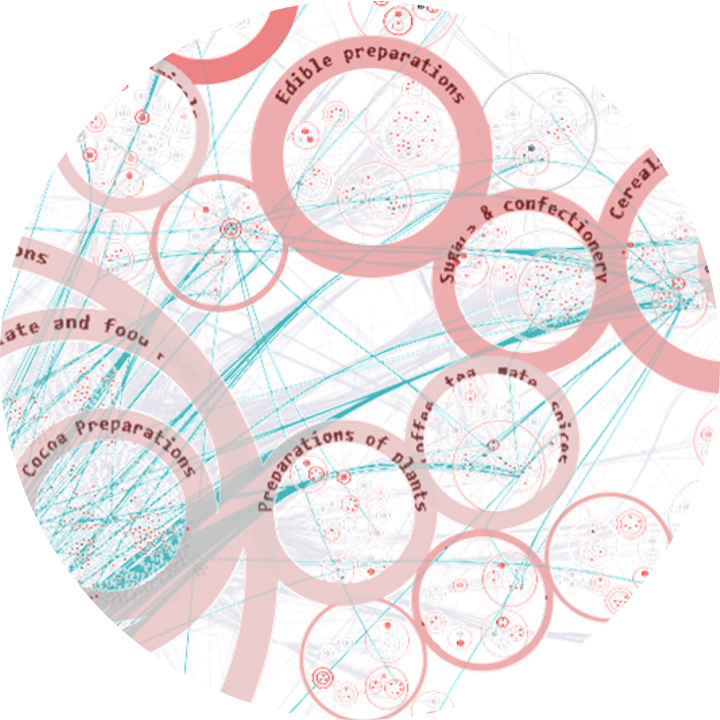
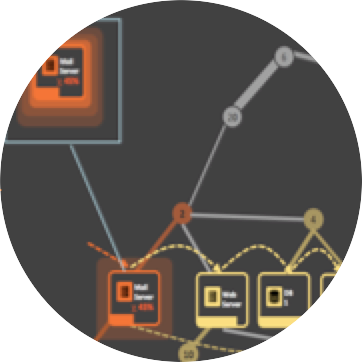
We present a human-in-the-loop (HITL) visual analytics approach that enhances systemic risk assessment through the domain-specific integration of hierarchical grouping, clustering, edge bundling, labeling, and zooming techniques. Our contribution is the deliberate combination of these methods to support perceptual scalability, enabling users to explore large, complex networks more effectively and reason about systemic vulnerabilities.
Field
Graphs

2026
2025
-
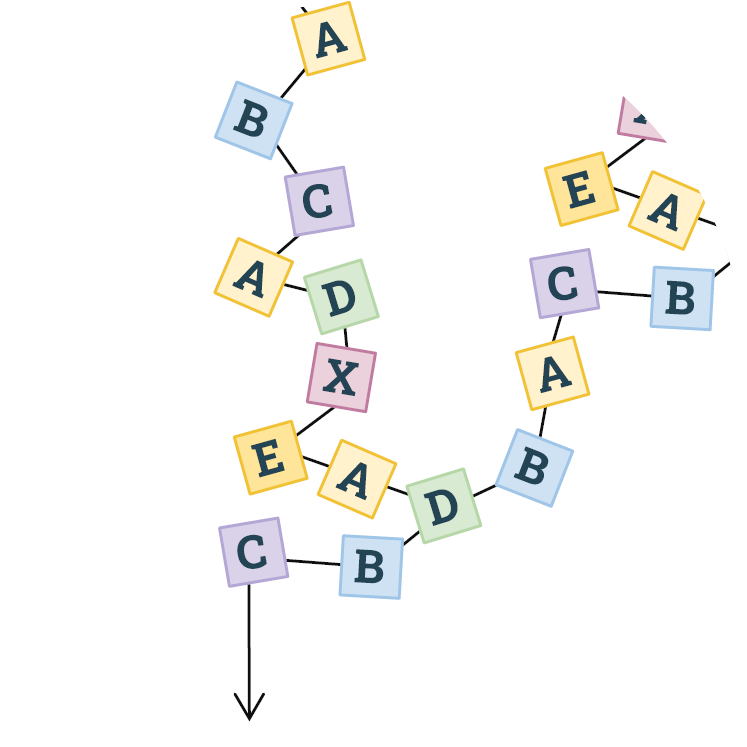
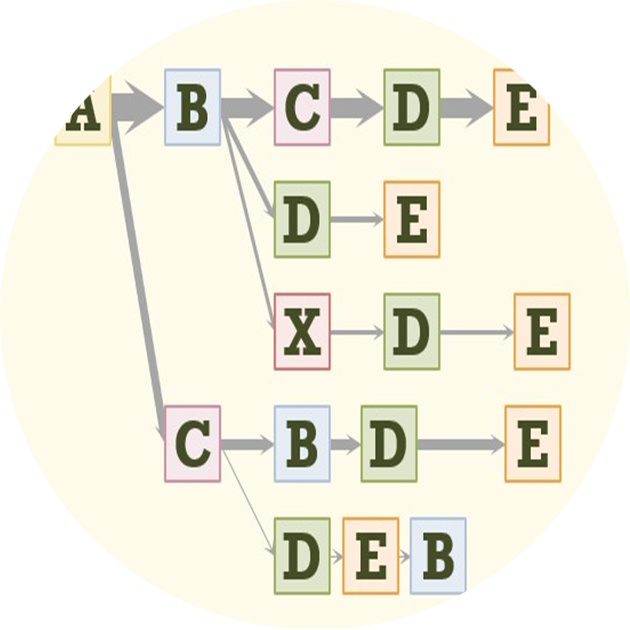
Journey analytics create sequences that can be understood with graph-oriented visual analytics. We have designed and implemented more than a dozen visual analytics on sequence data in production software over the last 20 years. We outline and demonstrate a variety of data challenges, user tasks, visualization layouts, node and edge representations, and interactions, including strengths and weaknesses of the various approaches. We also discuss how AI and LLMs can significantly improve these analyses.
2024
-
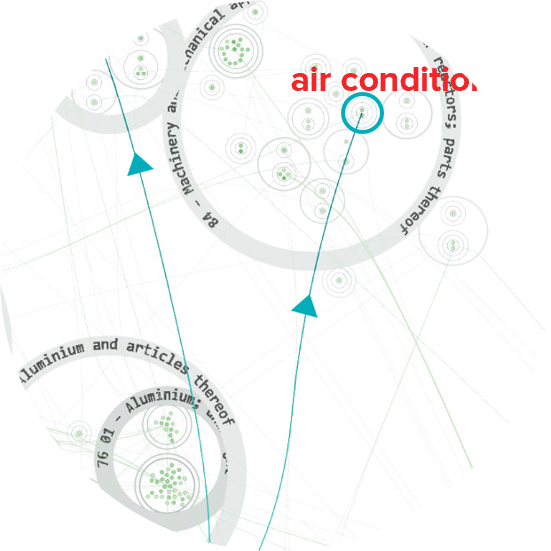
The DARPA Resilient Supply-and-Demand Network (RSDN) program intends to expose and mitigate sources of surprise in supply-demand networks. In addition to DARPA, eight teams are working on solutions. Among them, Uncharted is assembling big data into a graph model with interactive visual analytics combining hierarchical large-scale graph visualization with on-the-fly what-if scenario analysis to uncover and assess systemic risk. In this panel discussion, each team provides a lightning overview of their research.
-
Process mining and more broadly journey analytics create sequences that can be understood with graph-oriented visual analytics. We have designed and implemented more than a dozen visual analytics on sequence data in production software over the last 20 years. We outline a variety of data challenges, user tasks, visualization layouts, node and edge representations, and interactions, including strengths and weaknesses and potential future research.
2023
-
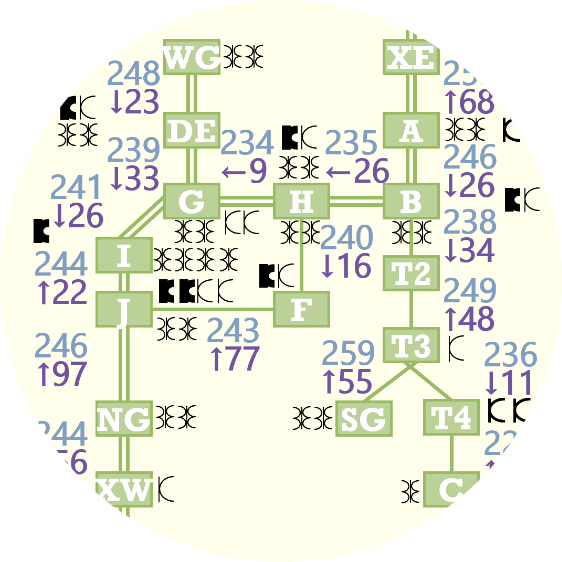
Electric networks are globally significant systems being transformed to support increased wind and solar generation. To structure development of real-time operator support, we developed a conceptual model of electric transmission network operation that represents physical, functional, and purposeful distinctions and summaries used by experts at a North American transmission operator and reliability coordinator.
-
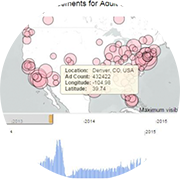
TellFinder is a software platform that enables counter human trafficking investigators to search and visualize many millions of enriched adult service ads from the deep web. In this talk we discuss how TellFinder works and how it has impacted investigations and prosecutions during its active deployment with various agencies.
-
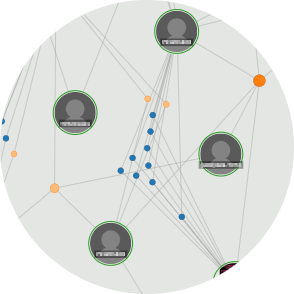
Analysts tasked with solving social problems like human trafficking rely on long-established processes and field experience. Broad artificial intelligence solutions to these problems have good intentions, but they often omit nuance and context that analysts bring. In this talk, we present Uncharted’s approach to designing “augmented intelligence” tools for global resilience that let both humans and machines do what they do best.
2022
-
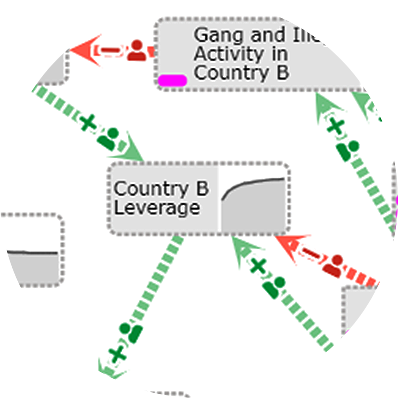
The construction of computational causal models for complex systems has typically been completed manually by domain experts and is a time-consuming, cumbersome process. We introduce Causeworks, an application in which operators “sketch” complex systems, leverage AI tools and expert knowledge to transform the sketches into computational causal models, and then apply analytics to understand how to influence the system.
2021
-
 Best Paper, VAHC Workshop, IEEE VIS 2021
This paper describes an ongoing multi-scale visual analytics approach for exploring and analyzing biomedical knowledge at scale. We utilize global and local views, hierarchical and flow-based graph layouts, multi-faceted search, neighborhood recommendations, and document visualizations to help researchers interactively explore, query, and analyze biological graphs against the backdrop of biomedical knowledge.
-
Modeling complex systems is a time-consuming, difficult and fragmented task, often requiring the analyst to work with disparate data, a variety of models, and expert knowledge across a diverse set of domains. Applying a user-centered design process, we developed a mixed-initiative visual analytics approach, a subset of the Causemos platform, that allows analysts to rapidly assemble qualitative causal models of complex socio-natural systems.
-
Biologists grapple with large multi-scale graphs to find relevant subgraphs for answering a range of biological questions. Our approach for scalable graph analysis enables biologists to interactively explore, query, and analyze biological graphs at different scales. Computational biologists see promise in our approach for various use cases such as drug interactions and disease propagation.
-
The covert nature of sex trafficking provides a significant barrier to generating large-scale, data-driven insights to inform law enforcement, policy and social work. We leverage massive deep web data (collected globally from leading commercial sex websites) in tandem with a novel machine learning framework to unmask suspicious recruitment-to-sales pathways, thereby providing the first global network view of trafficking risk in commercial sex supply chains.
-
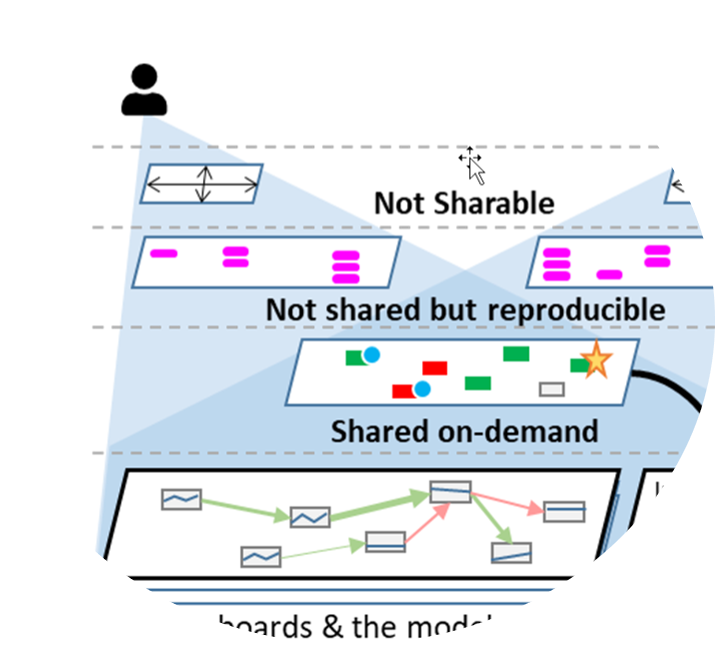
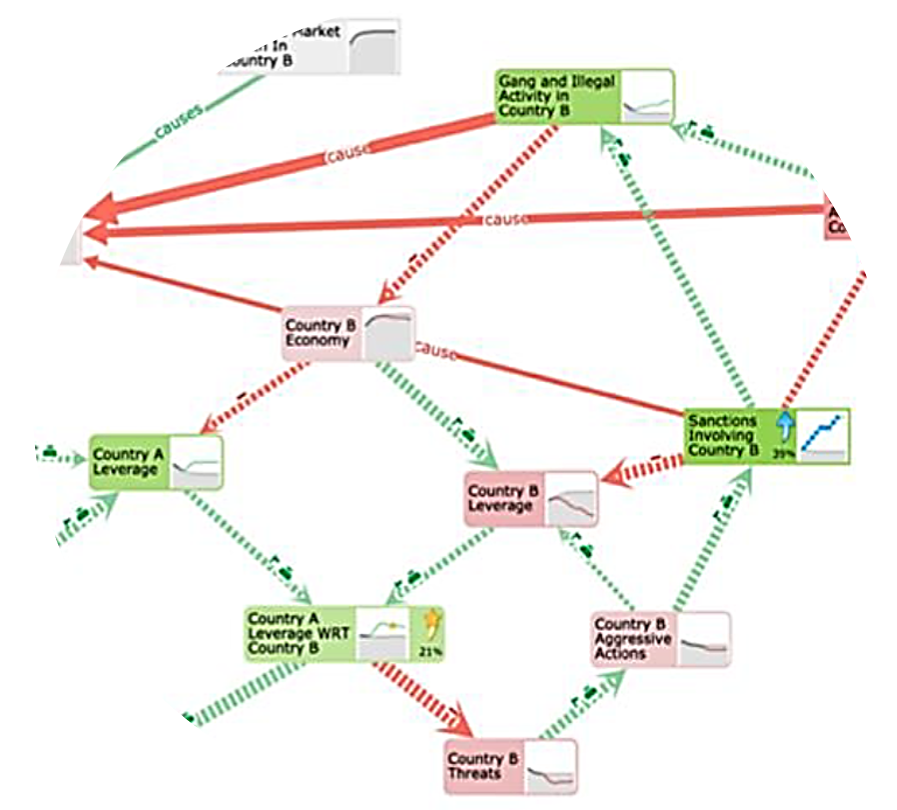
Military planners use “Operational Design” (OD) to understand systems and relationships in complex operational environments. Causeworks is a visual analytics application for OD teams to collaboratively build causal models of environments to understand and find solutions to affect them. Collaborative causal modeling can help teams craft better plans, but there are unique challenges in developing synchronous collaboration tools for building and using causal models. Causeworks overlays analytics inputs and outputs over a shared causal model to flexibly support multiple modeling tasks simultaneously in a collaborative environment with minimal state management burden on users.
-
Causal Model building for complex problems has typically been completed manually by domain experts and is currently a time-consuming, cumbersome process. The resulting models are simple diagrams produced on whiteboards, and do not support computational analytics, thus limiting usefulness. Causeworks helps operators “sketch” complex systems, and transforms sketches into computational causal models using automatic and semi-automatic causal model construction from knowledge extracted from unstructured and structured documents. Causeworks integrates computational analytics to assist users in understanding and influencing the system.


2020
-
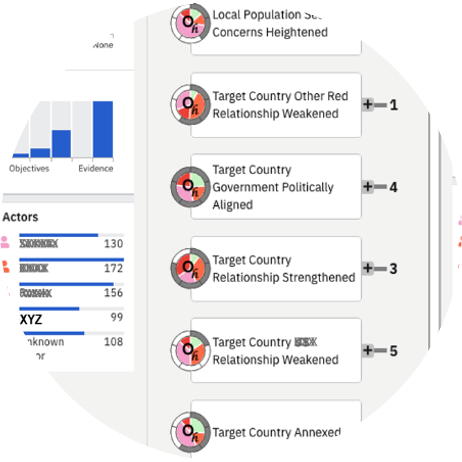
Strategy Mapper is a visual analytic tool for human-machine decision making in complex situations with uncertainty in estimating and understanding a competitor’s intent and tactics. Users can compare and reason through multiple hypotheses about one or more competitor’s behaviors, and consider recommendations to probe for more information. Using the “Gray Zone” as an application example, a user evaluation exercise shows the methods are usable and effective.
-
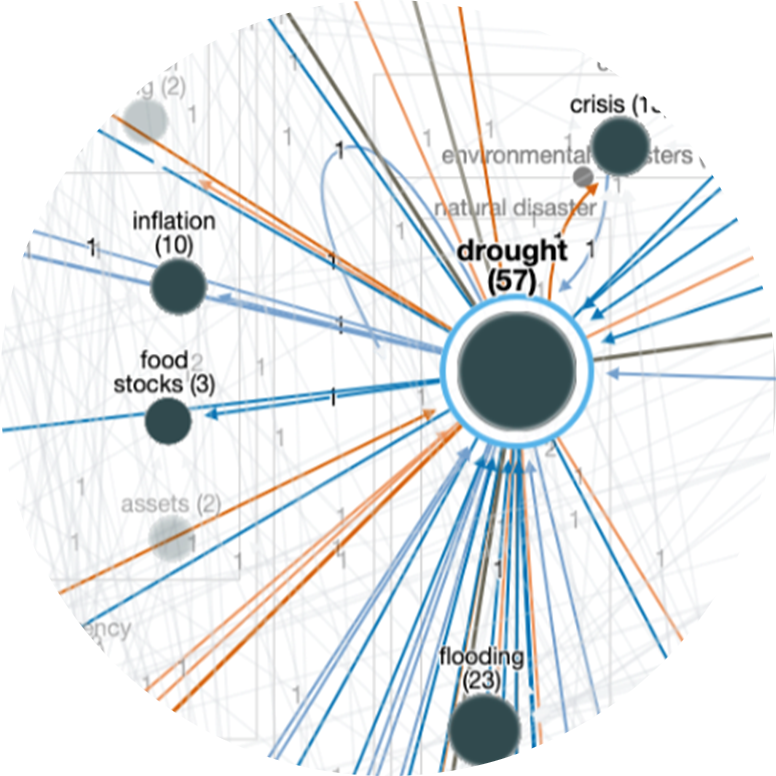
Visualization has recently gained a foothold in the field of artificial intelligence research. Typically, this work has focused on visualizing modules or specific dynamics of machine learning models, doing so for the purposes of model explainability or for visual debugging. Drawing from ongoing projects involving pandemic analysis and famine shocks, this seminar describes research efforts on graphical modeling where visualization functions as the medium for modeling itself.

2018
-
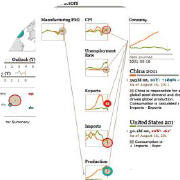
Causality is important for providing explanations when using computational models to understand complex systems structure and behavior, and what happens when change occurs in the system. There are many properties of causality that need to be considered and made visible, but current causality visualization methods are limited in expressions, scale, dimensionality and do not provide sufficient support for user tasks such as “what-if” and “how-to” questions, or in supporting groups considering multiple scenarios.
2017
-
Decision support systems for network security represent a critical element in the safe operation of computer networks. Unfortunately, due to their complexity, it can be difficult to implement and empirically assess novel techniques for displaying networks. This paper details an open source adaptive user interface that hopes to fill this gap. This system supports agile development and offers a wide latitude for human factors and machine learning design modifications. The intent of this system is to serve as an experimental testbed for determining the efficacy of different human factors and machine learning initiatives on operator performance in network monitoring.
-
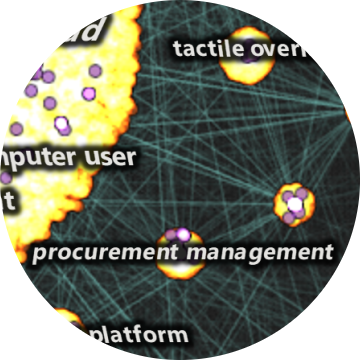
Text analytics have significantly advanced with techniques such as entity extraction and characterization, topic and opinion analysis, and sentiment and emotion extraction. But the visualization of text has advanced much more slowly. Recent visualization techniques for text, however, are providing new capabilities. In this talk we offer an overview of these new ways to organize massive volumes of text, characterize subjects, score synopses, and skim through a lot of documents. Together, these techniques can improve workflows for users focused on documents.
-
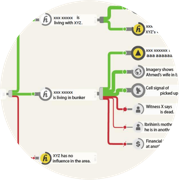
Argument Mapper provides an easy-to-use, theoretically sound, web-based interactive software tool that enables the application of evidence-based reasoning to analytic questions. Designed in collaboration with analytic methodologists, this tool combines structured argument mapping methodology with visualization techniques to help analysts make sense of complex problems and overcome cognitive biases.
2016
-
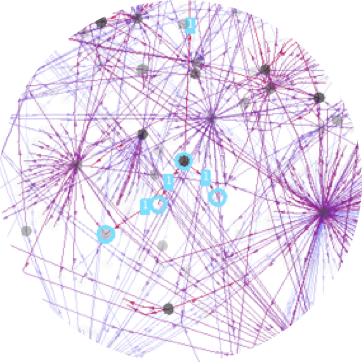
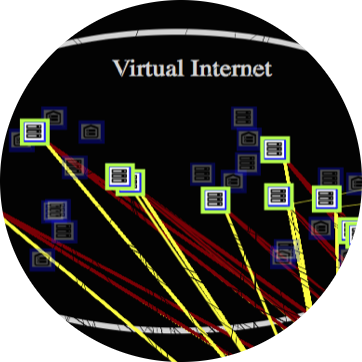
We are investigating FocalPoint, an adaptive level of detail (LOD) recommender system tailored for hierarchical network information structures. FocalPoint reasons about contextual information associated with the network, user task, and user cognitive load to tune the presentation of network visualization displays to improve user performance in perception, comprehension and projection of current situational awareness. Our system is applied to two complex information constructs important to dynamic cyber network operations: network maps and attack graphs.
-
Our research focus is on developing FocalPoint, a system that provides Adaptive Level of Detail (LOD) in user interfaces for cybersecurity operations. FocalPoint is a recommender system tailored for complex network information structures that reasons about contextual information associated with the network, user tasks, and cognitive load. This facilitates tuning cyber visualization displays, thereby improving user performance in perception, comprehension and projection of current Cybersecurity Situational Awareness (Cyber SA).
-
Graph visualizations increase the perception of entity relationships in a network. However, as graph size and density increase, readability rapidly diminishes. In this cover article for the July 2017 edition of the Information Visualization journal, we present an end-to-end, tile-based visual analytic approach called graph mapping that utilizes cluster computing to turn large-scale graph (node-link) data into interactive visualizations in modern web browsers.
2015
-
Graph visualizations increase the perception of entity relationships in a network. However, as graph size and density increase, readability rapidly diminishes. In this paper, we present a tile-based visual analytic approach that leverages cluster computing to create large-scale, interactive graph visualizations in modern web browsers. Our approach is optimized for analyzing community structure and relationships.
-
In this paper, we present lessons learned in the development of TellFinder, a tool designed to explore domain-specific web crawls using graph analysis and multi-modal visualization. The initial application of the tool was to help combat human trafficking through entity resolution and characterization based on data from sex ads crawled from a variety of publicly available sites.
-
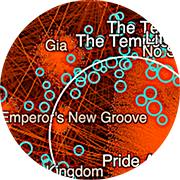
This session demonstrates using open source tools and techniques for visually exploring massive node-link graphs in a web browser by visualizing all the data. Seeing all the data reveals informative patterns and provides important context to understanding insights. Examples will highlight large-scale graph analysis of social networks, customer purchase history, and healthcare industry data.
-
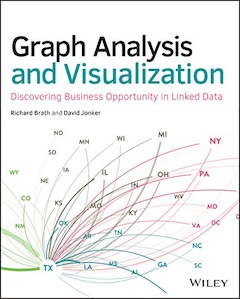
Graph Analysis and Visualization brings graph theory out of the lab and into the real world. Using sophisticated methods and tools that span analysis functions, this guide shows you how to exploit graph and network analytic techniques to enable the discovery of new business insights and opportunities.
2014
-
[Short Paper] Humans are vulnerable to cognitive biases such as neglect of probability, framing effect, confirmation bias, conservatism (belief revision) and anchoring. The Argument Mapper addresses these biases in intelligence analysis by providing an easy-to-use, theoretically sound, web-based interactive software tool that enables the application of evidence-based reasoning to analytic questions.
-
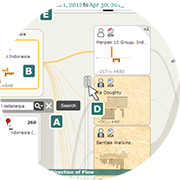
In this paper, we present in-progress work on “Influent,” a graph analysis tool that enables an intelligence analyst to visually and interactively “follow the money” or other transaction flow. Summary visualizations of transactional patterns and entity characteristics, a left-to-right semantic flow layout, interactive link expansion and hierarchical entity clustering enable Influent to operate effectively at scale with millions of entities and hundreds of millions of transactions, with larger data sets in progress.
2013
-
Visual aggregation techniques, tools and easily tailorable components are needed that will support answering analytical questions with data description, characterization and interaction without loss of information. We present two case studies of prototype implementations of JavaScript browser-based visualization tools leveraging the Louvain clustering algorithm.
-
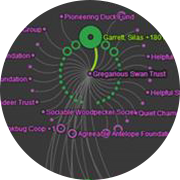
Big graphs are difficult to visualize because the scale of the data quickly results in complex network diagrams that can be difficult to decipher and have complicated interfaces with hundreds of options. Instead, we start by understanding what valuable nuggets we are trying to learn from this data, such as “Who’s connected to both me and my competition?” and “Did these people meet?” Starting from the question, we can then simplify the requirements and design effective visualizations that fit the problem. We will look at some mini-case studies and demos (e.g. Twitter correlation network, charity network).
2012
-
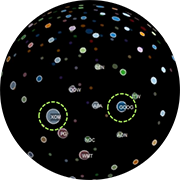
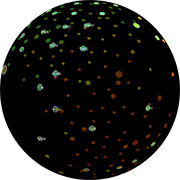
Use of a sphere as a basis for organizing an information visualization should balance issues such as occlusion against potential useful benefits such as natural navigational affordances and perceptual connotations of an application.
2011
-
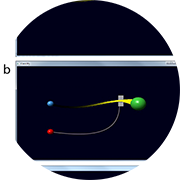
In this paper we report on our preliminary designs for Animated Attention Redirection Codes (AARCs), these are interactive short animated streaks traveling from a moused over symbol that convey information linkages in a transitory manner.
2010
2008
-
This paper traces progress from concept to prototype, and discusses how diagrams can be created, transformed and leveraged for analysis, including generating diagrams from knowledge bases, visualizing temporal concept maps, and the use of linked diagrams for exploring complex, multi-dimensional, sequences of events.