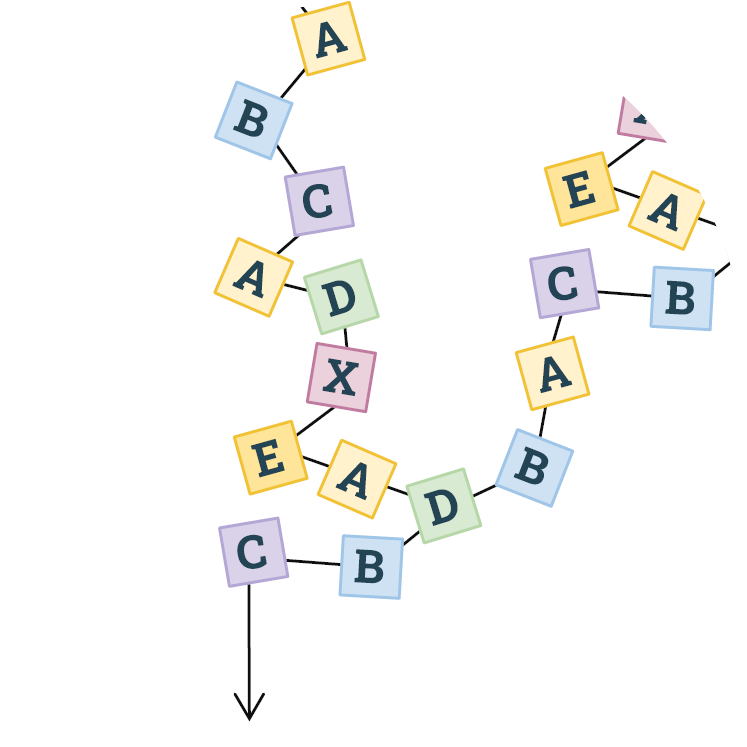
Journey analytics create sequences that can be understood with graph-oriented visual analytics. We have designed and implemented more than a dozen visual analytics on sequence data in production software over the last 20 years. We outline and demonstrate a variety of data challenges, user tasks, visualization layouts, node and edge representations, and interactions, including strengths and weaknesses of the various approaches. We also discuss how AI and LLMs can significantly improve these analyses.

2025
2024
-
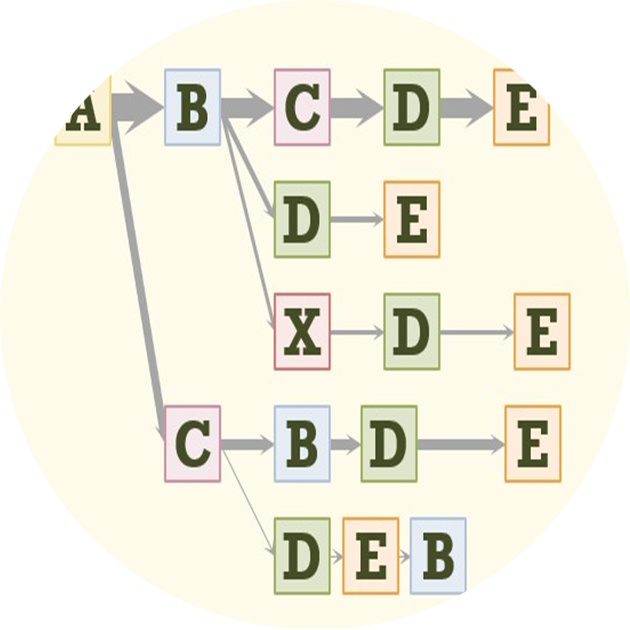
Process mining and more broadly journey analytics create sequences that can be understood with graph-oriented visual analytics. We have designed and implemented more than a dozen visual analytics on sequence data in production software over the last 20 years. We outline a variety of data challenges, user tasks, visualization layouts, node and edge representations, and interactions, including strengths and weaknesses and potential future research.
2015
-
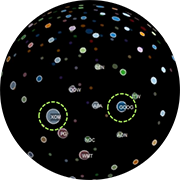
This session demonstrates using open source tools and techniques for visually exploring massive node-link graphs in a web browser by visualizing all the data. Seeing all the data reveals informative patterns and provides important context to understanding insights. Examples will highlight large-scale graph analysis of social networks, customer purchase history, and healthcare industry data.
2014
-
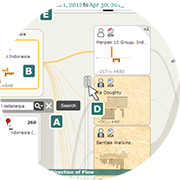
In this paper, we present in-progress work on “Influent,” a graph analysis tool that enables an intelligence analyst to visually and interactively “follow the money” or other transaction flow. Summary visualizations of transactional patterns and entity characteristics, a left-to-right semantic flow layout, interactive link expansion and hierarchical entity clustering enable Influent to operate effectively at scale with millions of entities and hundreds of millions of transactions, with larger data sets in progress.
2013
-
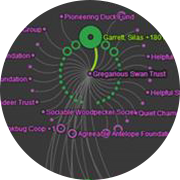
Visual aggregation techniques, tools and easily tailorable components are needed that will support answering analytical questions with data description, characterization and interaction without loss of information. We present two case studies of prototype implementations of JavaScript browser-based visualization tools leveraging the Louvain clustering algorithm.
-
Big graphs are difficult to visualize because the scale of the data quickly results in complex network diagrams that can be difficult to decipher and have complicated interfaces with hundreds of options. Instead, we start by understanding what valuable nuggets we are trying to learn from this data, such as “Who’s connected to both me and my competition?” and “Did these people meet?” Starting from the question, we can then simplify the requirements and design effective visualizations that fit the problem. We will look at some mini-case studies and demos (e.g. Twitter correlation network, charity network).