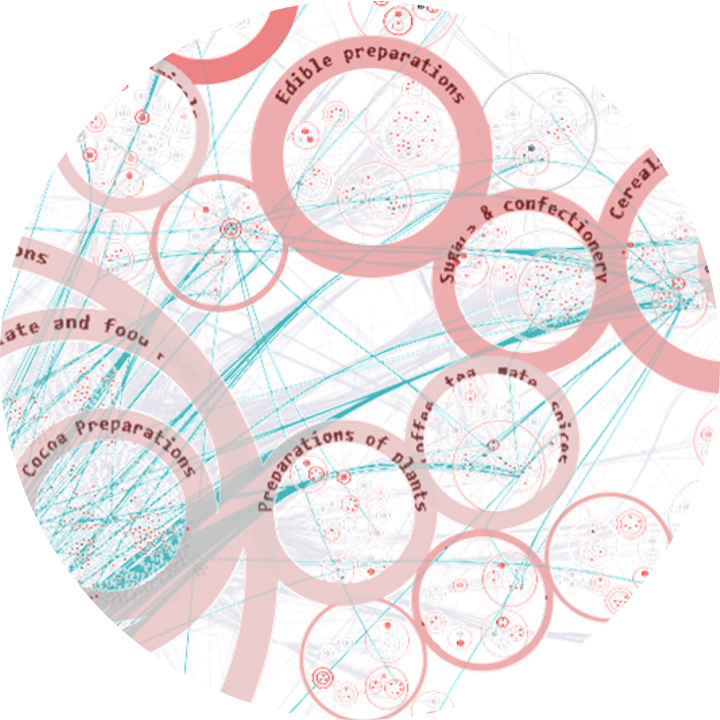

We present a human-in-the-loop (HITL) visual analytics approach that enhances systemic risk assessment through the domain-specific integration of hierarchical grouping, clustering, edge bundling, labeling, and zooming techniques. Our contribution is the deliberate combination of these methods to support perceptual scalability, enabling users to explore large, complex networks more effectively and reason about systemic vulnerabilities.
Field
Big Data

2026
2023
-
TellFinder is a software platform that enables counter human trafficking investigators to search and visualize many millions of enriched adult service ads from the deep web. In this talk we discuss how TellFinder works and how it has impacted investigations and prosecutions during its active deployment with various agencies.
-
Analysts tasked with solving social problems like human trafficking rely on long-established processes and field experience. Broad artificial intelligence solutions to these problems have good intentions, but they often omit nuance and context that analysts bring. In this talk, we present Uncharted’s approach to designing “augmented intelligence” tools for global resilience that let both humans and machines do what they do best.
2021
-
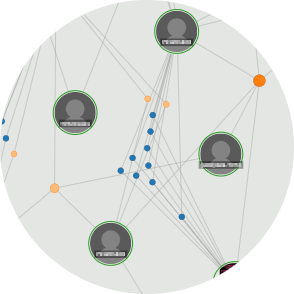
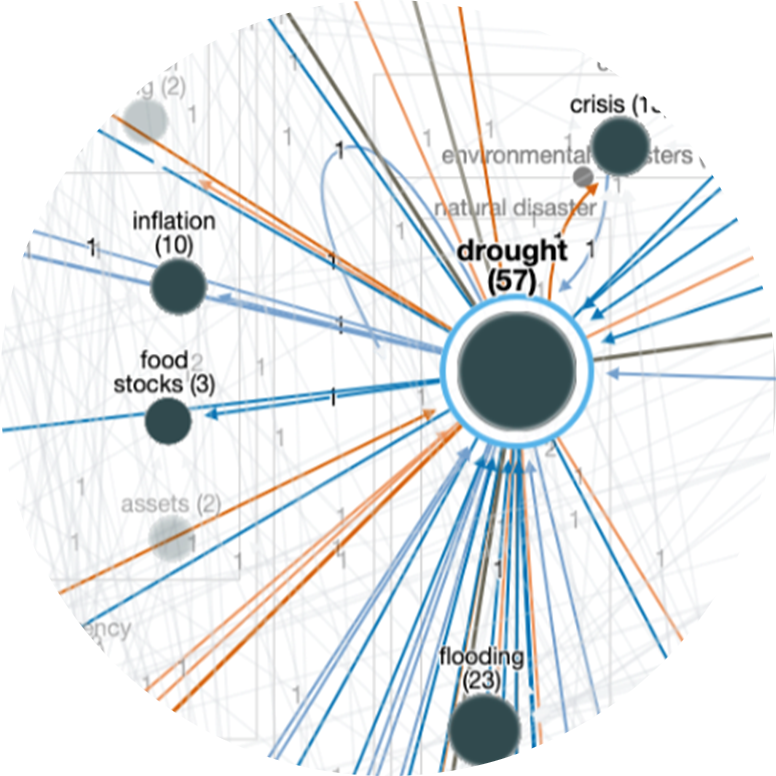
The covert nature of sex trafficking provides a significant barrier to generating large-scale, data-driven insights to inform law enforcement, policy and social work. We leverage massive deep web data (collected globally from leading commercial sex websites) in tandem with a novel machine learning framework to unmask suspicious recruitment-to-sales pathways, thereby providing the first global network view of trafficking risk in commercial sex supply chains.

2018
-
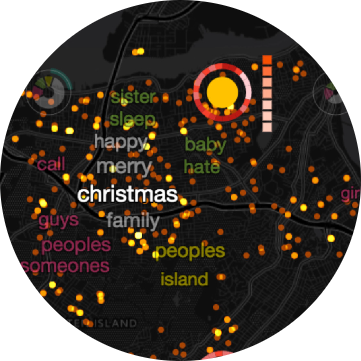
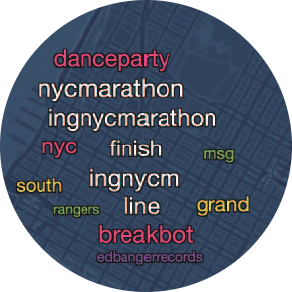
Detecting anomalous events of a particular area in a timely manner is an important task. Geo-tagged social media data are useful resources, but the abundance of everyday language in them makes this task still challenging. To address such challenges, we present TopicOnTiles, a visual analytics system that can reveal the information relevant to anomalous events in a multi-level tile-based map interface by using social media data. To this end, we adopt and improve a recently proposed topic modeling method that can extract spatio-temporally exclusive topics corresponding to a particular region and a time point.
2017
-
We propose herein a novel topic modeling approach on text documents with spatio-temporal information (e.g., when and where a document was published) such as location-based social media data to discover prevalent topics or newly emerging events with respect to an area and a time point. We consider a map view composed of regular grids or tiles with each showing topic keywords from documents of the corresponding region. To this end, we present a tile-based spatio-temporally exclusive topic modeling approach called STExNMF, based on a novel nonnegative matrix factorization (NMF) technique.
-
Text analytics have significantly advanced with techniques such as entity extraction and characterization, topic and opinion analysis, and sentiment and emotion extraction. But the visualization of text has advanced much more slowly. Recent visualization techniques for text, however, are providing new capabilities. In this talk we offer an overview of these new ways to organize massive volumes of text, characterize subjects, score synopses, and skim through a lot of documents. Together, these techniques can improve workflows for users focused on documents.
2016
-
We present a visual analytics system that supports the geospatiotemporal analysis of social media data based on a large-scale distributed topic modeling technique. Through the analysis of social media data in a given time and region, we can identify critical events in real time. However, it takes significant time to perform such analyses against a large amount of social media data. As a way to handle this issue, we developed an efficient tile-based topic modeling approach, which divides textual data into multiple subsets with respect to different regions and time frames at different zoom levels and applies topic modeling to each subset.
-
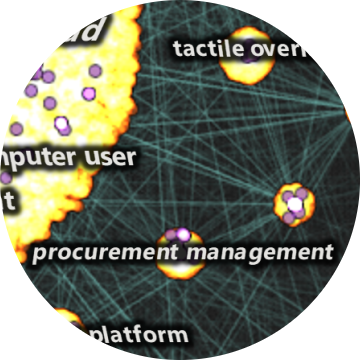
Graph visualizations increase the perception of entity relationships in a network. However, as graph size and density increase, readability rapidly diminishes. In this cover article for the July 2017 edition of the Information Visualization journal, we present an end-to-end, tile-based visual analytic approach called graph mapping that utilizes cluster computing to turn large-scale graph (node-link) data into interactive visualizations in modern web browsers.
2015
-
Graph visualizations increase the perception of entity relationships in a network. However, as graph size and density increase, readability rapidly diminishes. In this paper, we present a tile-based visual analytic approach that leverages cluster computing to create large-scale, interactive graph visualizations in modern web browsers. Our approach is optimized for analyzing community structure and relationships.
-
In this paper, we present lessons learned in the development of TellFinder, a tool designed to explore domain-specific web crawls using graph analysis and multi-modal visualization. The initial application of the tool was to help combat human trafficking through entity resolution and characterization based on data from sex ads crawled from a variety of publicly available sites.
-
In this paper, we present in-progress work on applications of tile-based visual analytics (TBVA) to population pattern of life analysis and geo-temporal event detection. TBVA uses multiresolution data tiling, analytics and layered high-fidelity visualization to enable interactive multi-scale analysis of billions of records in modern web browsers through techniques made familiar by online map services.
-
Analysts and data scientists work with large amounts of data, but the common approach, which dates back 20 years, is to roll up all the data into summary tables or charts, resulting in loss of detail. In contrast, direct visual exploratory analysis of massive amounts of raw data can yield insights that are otherwise overlooked. Here we highlight high-density visualizations that directly plot hundreds of millions of data points for applications such as market opportunity, periodicity analysis, and anomaly identification.
-
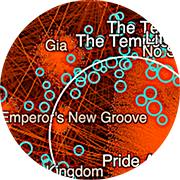
This session demonstrates using open source tools and techniques for visually exploring massive node-link graphs in a web browser by visualizing all the data. Seeing all the data reveals informative patterns and provides important context to understanding insights. Examples will highlight large-scale graph analysis of social networks, customer purchase history, and healthcare industry data.


2014
-
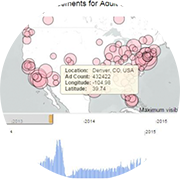
The open source Aperture Tiles provides interactive data exploration with continuous zooming on large scale datasets. By leveraging big data software stacks Hadoop, Apache Spark and HBase for distributed computation and storage, the technique can scale to data sets with billions of data points or more. In this talk we review the Tile-based visual analytic methodology, challenges and highlight some example applications.
-
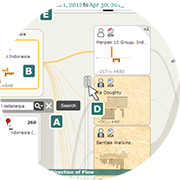
In this paper, we present in-progress work on “Influent,” a graph analysis tool that enables an intelligence analyst to visually and interactively “follow the money” or other transaction flow. Summary visualizations of transactional patterns and entity characteristics, a left-to-right semantic flow layout, interactive link expansion and hierarchical entity clustering enable Influent to operate effectively at scale with millions of entities and hundreds of millions of transactions, with larger data sets in progress.

2013
-
The widespread use and adoption of web-based geo maps have provided a familiar set of interactions for exploring extremely large geo data spaces and can be applied to similarly large abstract data spaces. Building on these techniques, a tile based visual analytics system (TBVA) was developed that demonstrates interactive visualization for a one billion point Twitter dataset.
-
Visual aggregation techniques, tools and easily tailorable components are needed that will support answering analytical questions with data description, characterization and interaction without loss of information. We present two case studies of prototype implementations of JavaScript browser-based visualization tools leveraging the Louvain clustering algorithm.
-
Our goal is to develop new automated tools to produce effective raw data characterization on extremely large datasets. This paper reports on the development of a web based interactive scatter plot prototype that uses tile-based rendering similar to geographic maps and interaction paradigms.
-
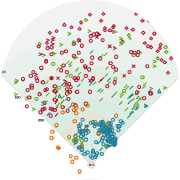
Visualization of big data in baseball at the per pitch level including measured data and video can be made effective for coaches and managers through a variety of information visualization techniques focused on creating easy to use and easy to understand visualizations.
-
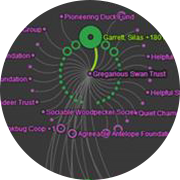
Big graphs are difficult to visualize because the scale of the data quickly results in complex network diagrams that can be difficult to decipher and have complicated interfaces with hundreds of options. Instead, we start by understanding what valuable nuggets we are trying to learn from this data, such as “Who’s connected to both me and my competition?” and “Did these people meet?” Starting from the question, we can then simplify the requirements and design effective visualizations that fit the problem. We will look at some mini-case studies and demos (e.g. Twitter correlation network, charity network).
-
Aperture is an open, adaptable and extensible Web 2.0 visualization framework, designed to produce visualizations for analysts and decision makers in any common web browser. Aperture utilizes a novel layer based approach to visualization assembly, and a data mapping API that simplifies the process of adaptable transformation of data and analytic results into visual forms and properties.


2012
-
This presentation covers some of the challenges and successes with baseball analytics and visualization and generalizes some of the lessons learned that could be much more broadly applicable, for example, to retailers or city planners. This was co-presented by Noah Schwartz of Bloomberg Sports and Richard Brath of Oculus.
2005
-
TRIST (“The Rapid Information Scanning Tool”) is the information retrieval and triage component for the analytical environment called nSpace. TRIST uses Human Information Interaction (HII) techniques to interact with massive data in order to quickly uncover the relevant, novel and unexpected.