From Royal Geographical Society with the Institute of British Geographers (RGS-IBG) conference
Technology
GeoTime
The publications and talks shown below relate to Uncharted’s prior development of GeoTime.

2012
2010
2008
-
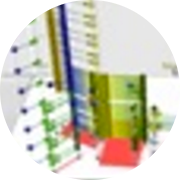
GeoTime and nSpace2 are interactive visual analytics tools that were used to examine and interpret all four of the 2008 VAST Challenge datasets. GeoTime excels in visualizing event patterns in time and space, or in time and any abstract landscape, while nSpace2 is a web-based analytical tool designed to support every step of the analytical process.
-
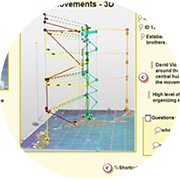
This paper traces progress from concept to prototype, and discusses how diagrams can be created, transformed and leveraged for analysis, including generating diagrams from knowledge bases, visualizing temporal concept maps, and the use of linked diagrams for exploring complex, multi-dimensional, sequences of events.
-
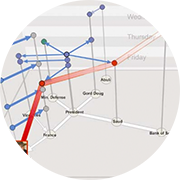
GeoTime is a unique capability for analyzing events, objects and activities within a combined temporal and geospatial display. Intelligence analysts can see the who and what in the where and when. CPOF CommandSight Visualizer is the 4D collaborative CPOF workspace component and the integrated visualizer for TAIS the Tactical Airspace Integration System. GeoTime and CPOF CommandSight are currently fielded systems with varying levels of integration with ESRI GIS systems.

2007
-
A story is a powerful abstraction used by intelligence analysts to conceptualize threats and understand patterns as part of the analytical process. This paper demonstrates a system that detects geo-temporal patterns and integrates story narration to increase analytic sense-making cohesion in GeoTime.
-
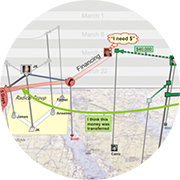
This paper is a detailed case study describing how the nSpace/GeoTime tools created an analytical environment that enabled two novice analysts to examine the scenario, discover patterns, trace connections, assess evidence, visually represent meaningful hypotheses with associated evidence, track progress, collaborate with others and then produce a final report.
2006
-
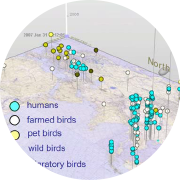
GeoTime and nSpace are new analysis tools that provide innovative visual analytic capabilities. This paper uses an epidemiology analysis scenario to illustrate and discuss these new investigative methods and techniques. In addition, this case study is an exploration and demonstration of the analytical synergy achieved by combining GeoTime’s geo-temporal analysis capabilities, with the rapid information triage, scanning and sensemaking provided by nSpace.
-
This paper presents innovative Sandbox human information interaction capabilities and the rationale underlying them including direct observations of analysis work as well as structured interviews. Key capabilities for the Sandbox include “put-this-there” cognition, automatic process model templates, gestures for the fluid expression of thought, assertions with evidence and scalability mechanisms to support larger analysis tasks.
2005
-
When creating a visualization for communication, the inclusion of aesthetically appealing elements can greatly increase a design’s appeal, intuitiveness and memorability. Used without care, this “sizzle” can reduce the effectiveness of the visualization by obscuring the intended message. Maintaining a focus on key design principles and an understanding of the target audience can result in an effective visualization for communication. This paper describes these principles and shows their use in creating effective designs.
-
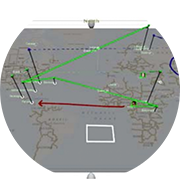
GeoTime is a new paradigm for visualizing events, connections and movement in a combined temporal and spatial visualization. This paper will show how this information visualization capability allows intelligence analysts to quickly reveal relationships between tracked movements and events of interest.
-
GeoTime visualization exploits the collection and storage of RFID data, and provides global in-transit visibility of the DoD supply chain down to the last tactical mile.
2004
-
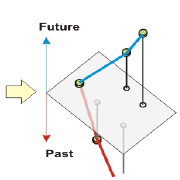
Analyzing observations over time and geography is a common task but typically requires multiple, separate tools. The objective of our research has been to develop a method to visualize, and work with, the spatial inter-connectedness of information over time and geography within a single, highly interactive 3-D view. A novel visualization technique for displaying and tracking events, objects and activities within a combined temporal and geospatial display has been developed. This technique has been implemented as a demonstrable prototype called GeoTime in order to determine potential utility.