
Click the above image for the interactive version
Last summer we began tracking tweets that mention Donald Trump in preparation for our talk at Strata NY. We’ve continued monitoring the topic and, as of March 3rd 2016, we’ve processed over 91 million tweets. For more information on the collection process, have a look at Two Days of Trump in Iowa.
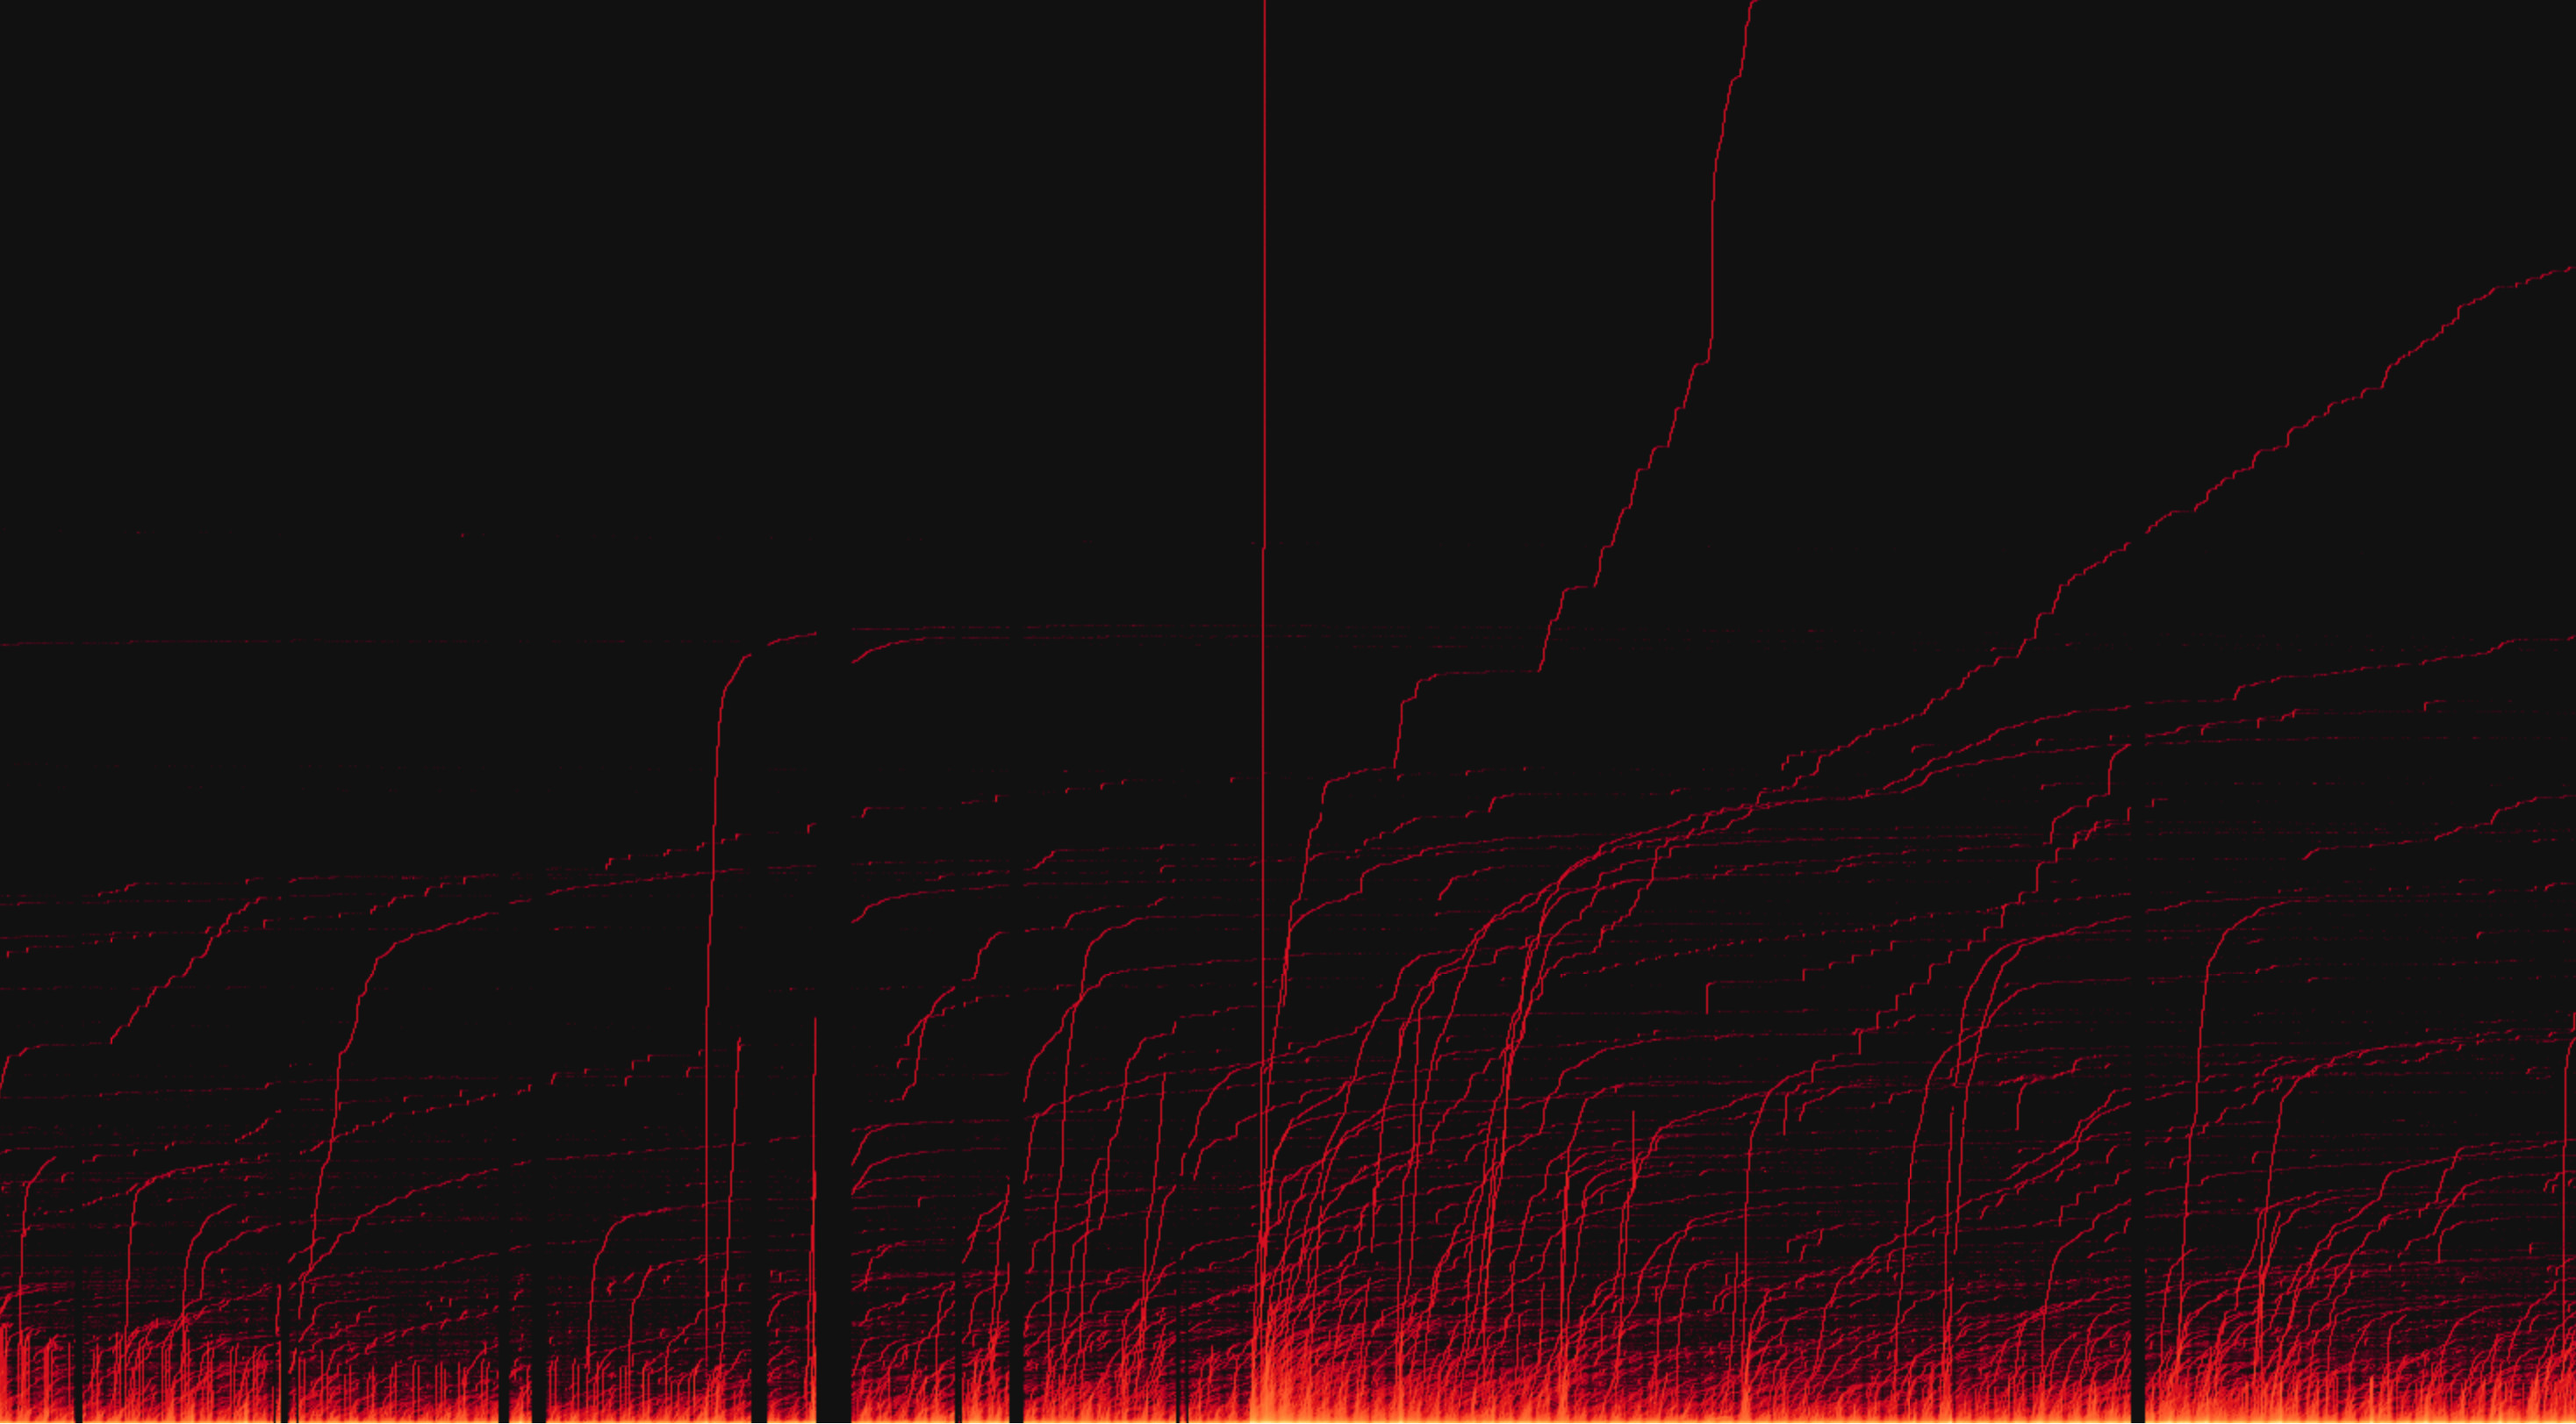
With Super Tuesday on the way, we decided to take a look at some of the most popular tweets related to Donald Trump and how engagement with them (measured in terms of retweets) can be visualized over time. What you see above is the result: a two-dimensional Salt visualization with time on the horizontal axis and number of retweets on the vertical axis, which supports zooming in the temporal dimension (stretching horizontally).
Patterns and Trends
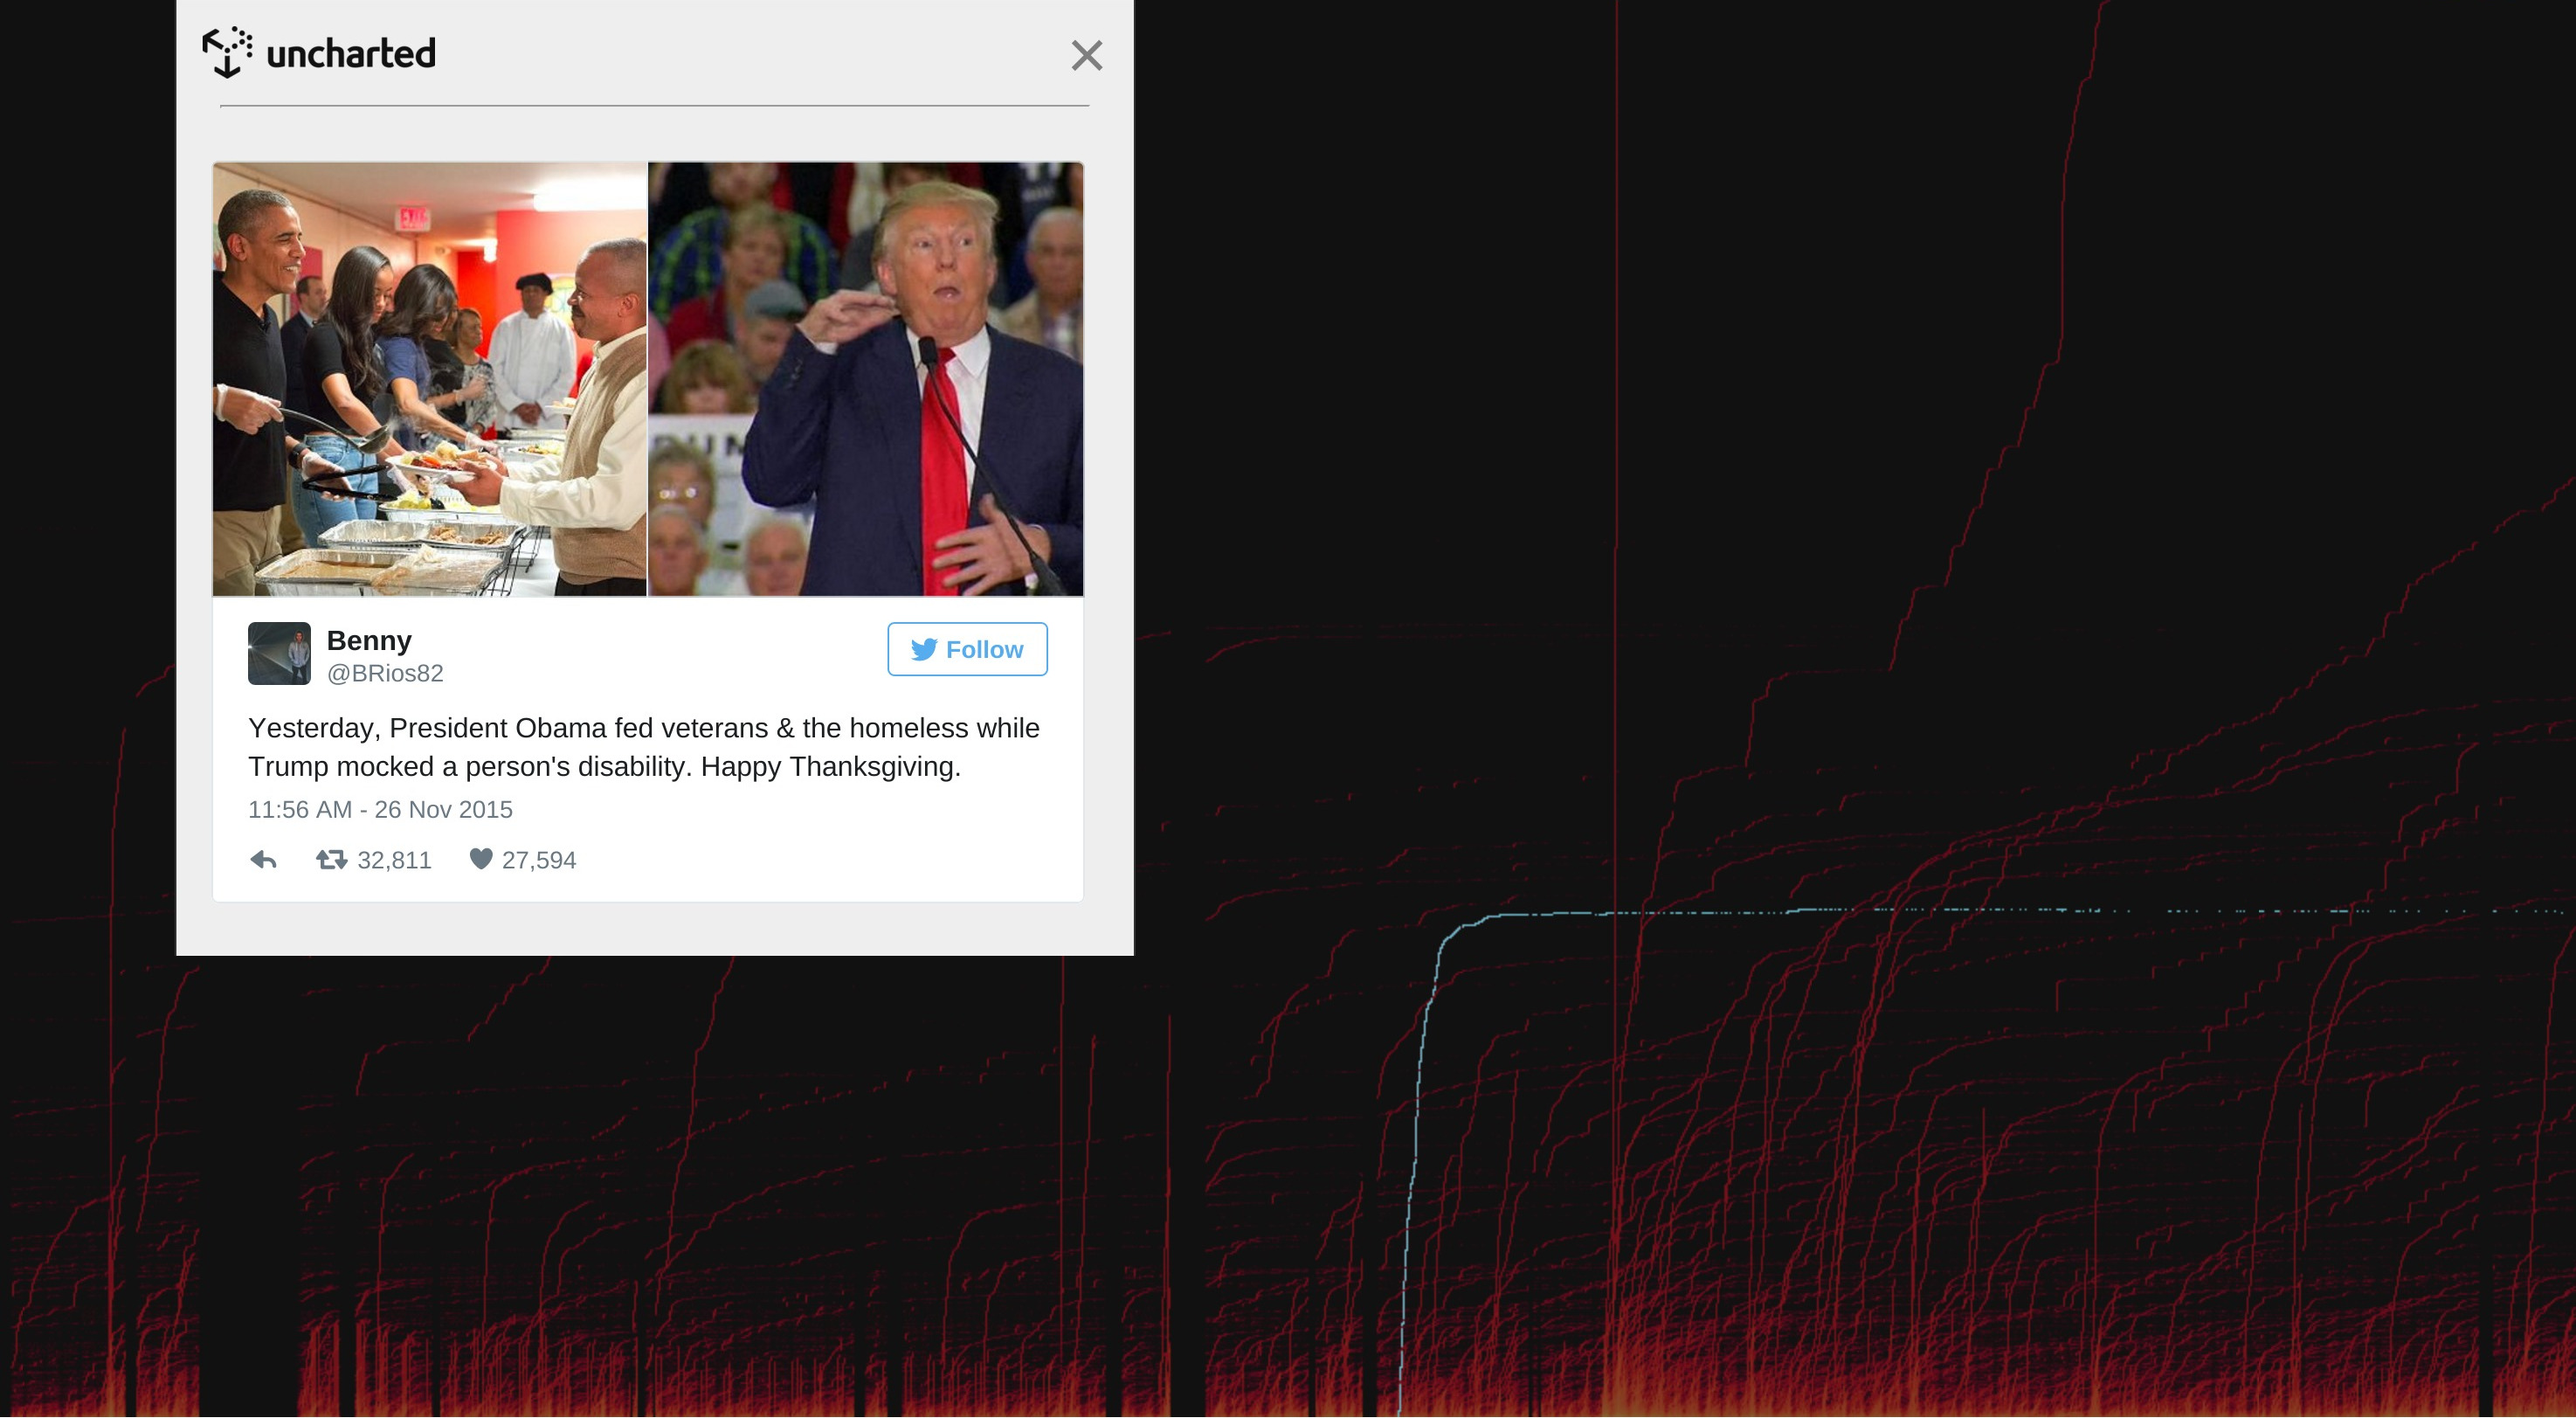
Each individual line represents a single tweet which, as it is retweeted, tends to rise rapidly over a short period of time and then level off as interest in the tweet wanes. The above tweet is a fantastic example. Interestingly, despite leveling off, we can see that the tweet in question does continue to be retweeted by individuals for months after its initial posting.
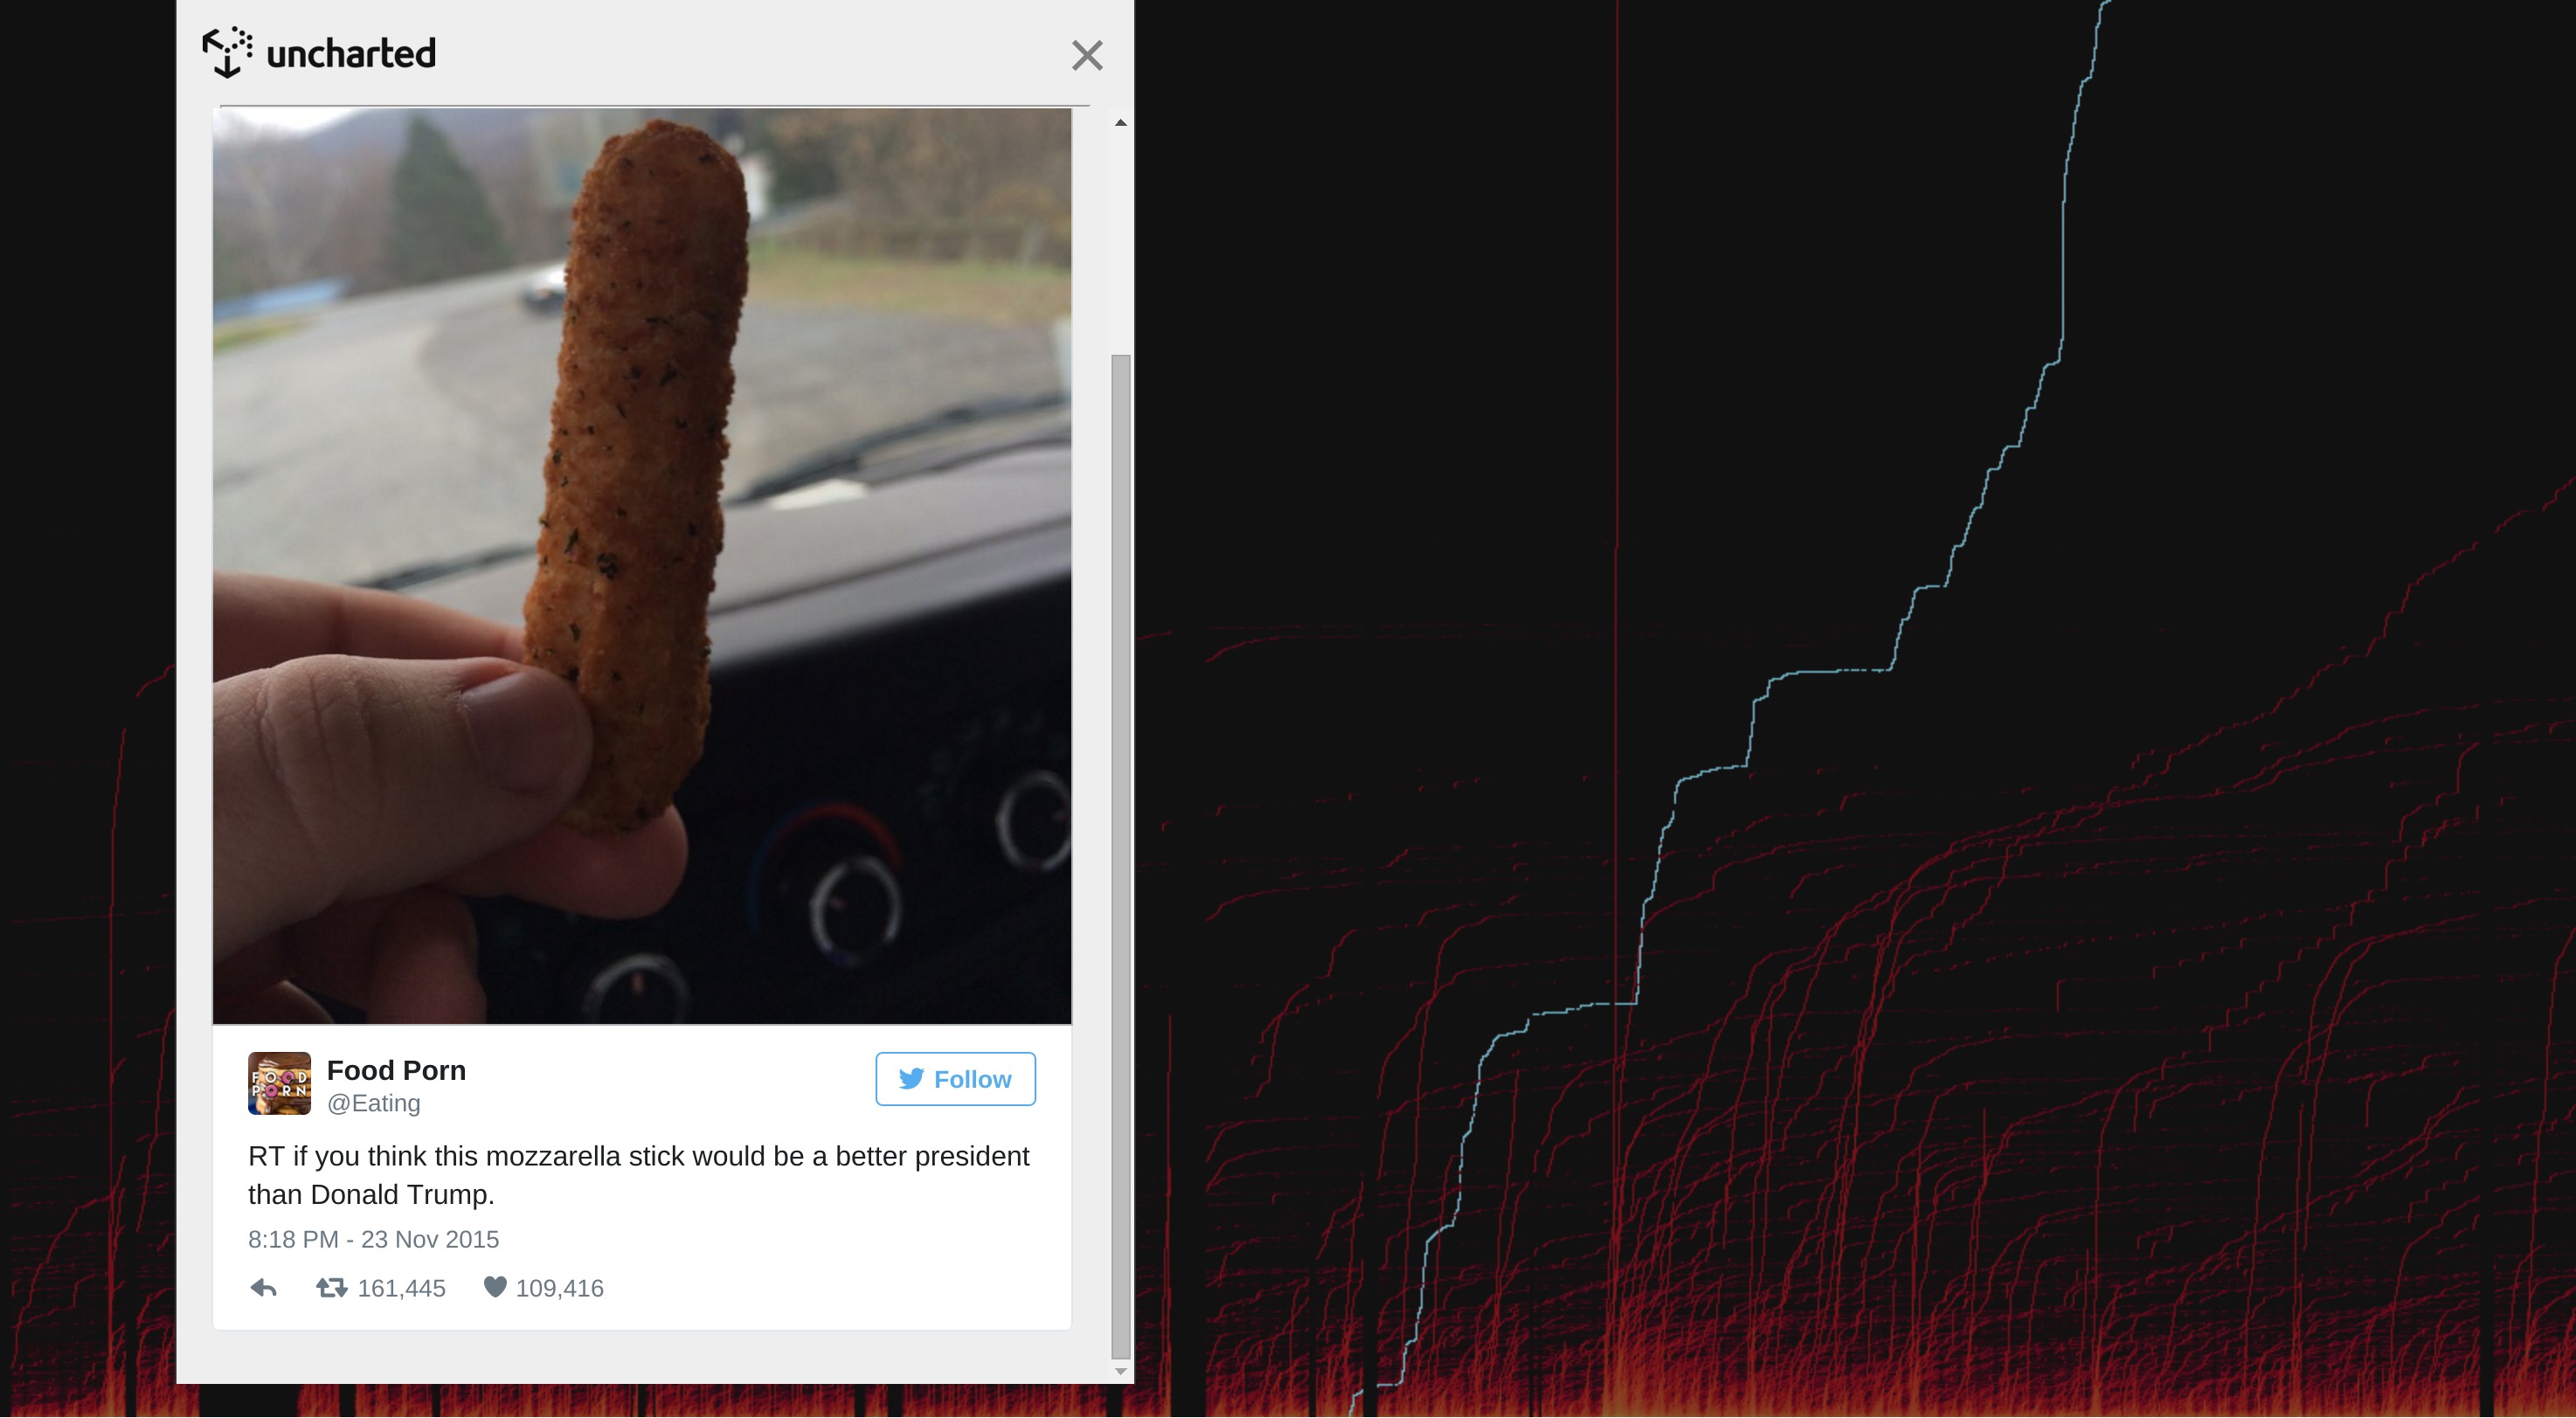
Some tweets show multiple periods of ongoing engagement. Below, a tweet concerning a mozzarella stick shows relatively weak initial activity followed by an immediate plateau. Three days later, it shoots up again with distinct plateaus of inactivity during the early AM hours EST (suggesting strong engagement in North America). This stepped pattern continues to present across the following months, with surges (including the first one) likely being a result of the tweet being retweeted by a popular Twitter user.
Have a look at the live demo yourself and let us know what you find!