An Uncharted research product for the visual analysis of massive graph data is featured in the pages and on the cover of the latest issue of Information Visualization, a leading peer-reviewed journal on the study and application of information visualization. Our contribution to this special issue—which is dedicated to big graph analytics and edited by leading research authorities in the field, David Haglin, David Trimm and Pak Chung Wong—details a novel method for visualizing the community relationships between millions of nodes and links in a network. This patent pending graph mapping approach uses a cluster computing framework and our Salt library to build hierarchical tile-based visual analytic (TBVA) layers of all the data across multiple aggregation levels. Graph mapping TBVA applications can be deployed as web-based applications that provide interactive graph analysis in any modern web browser.
Read More: Graph mapping: Multi-scale community visualization of massive graph data
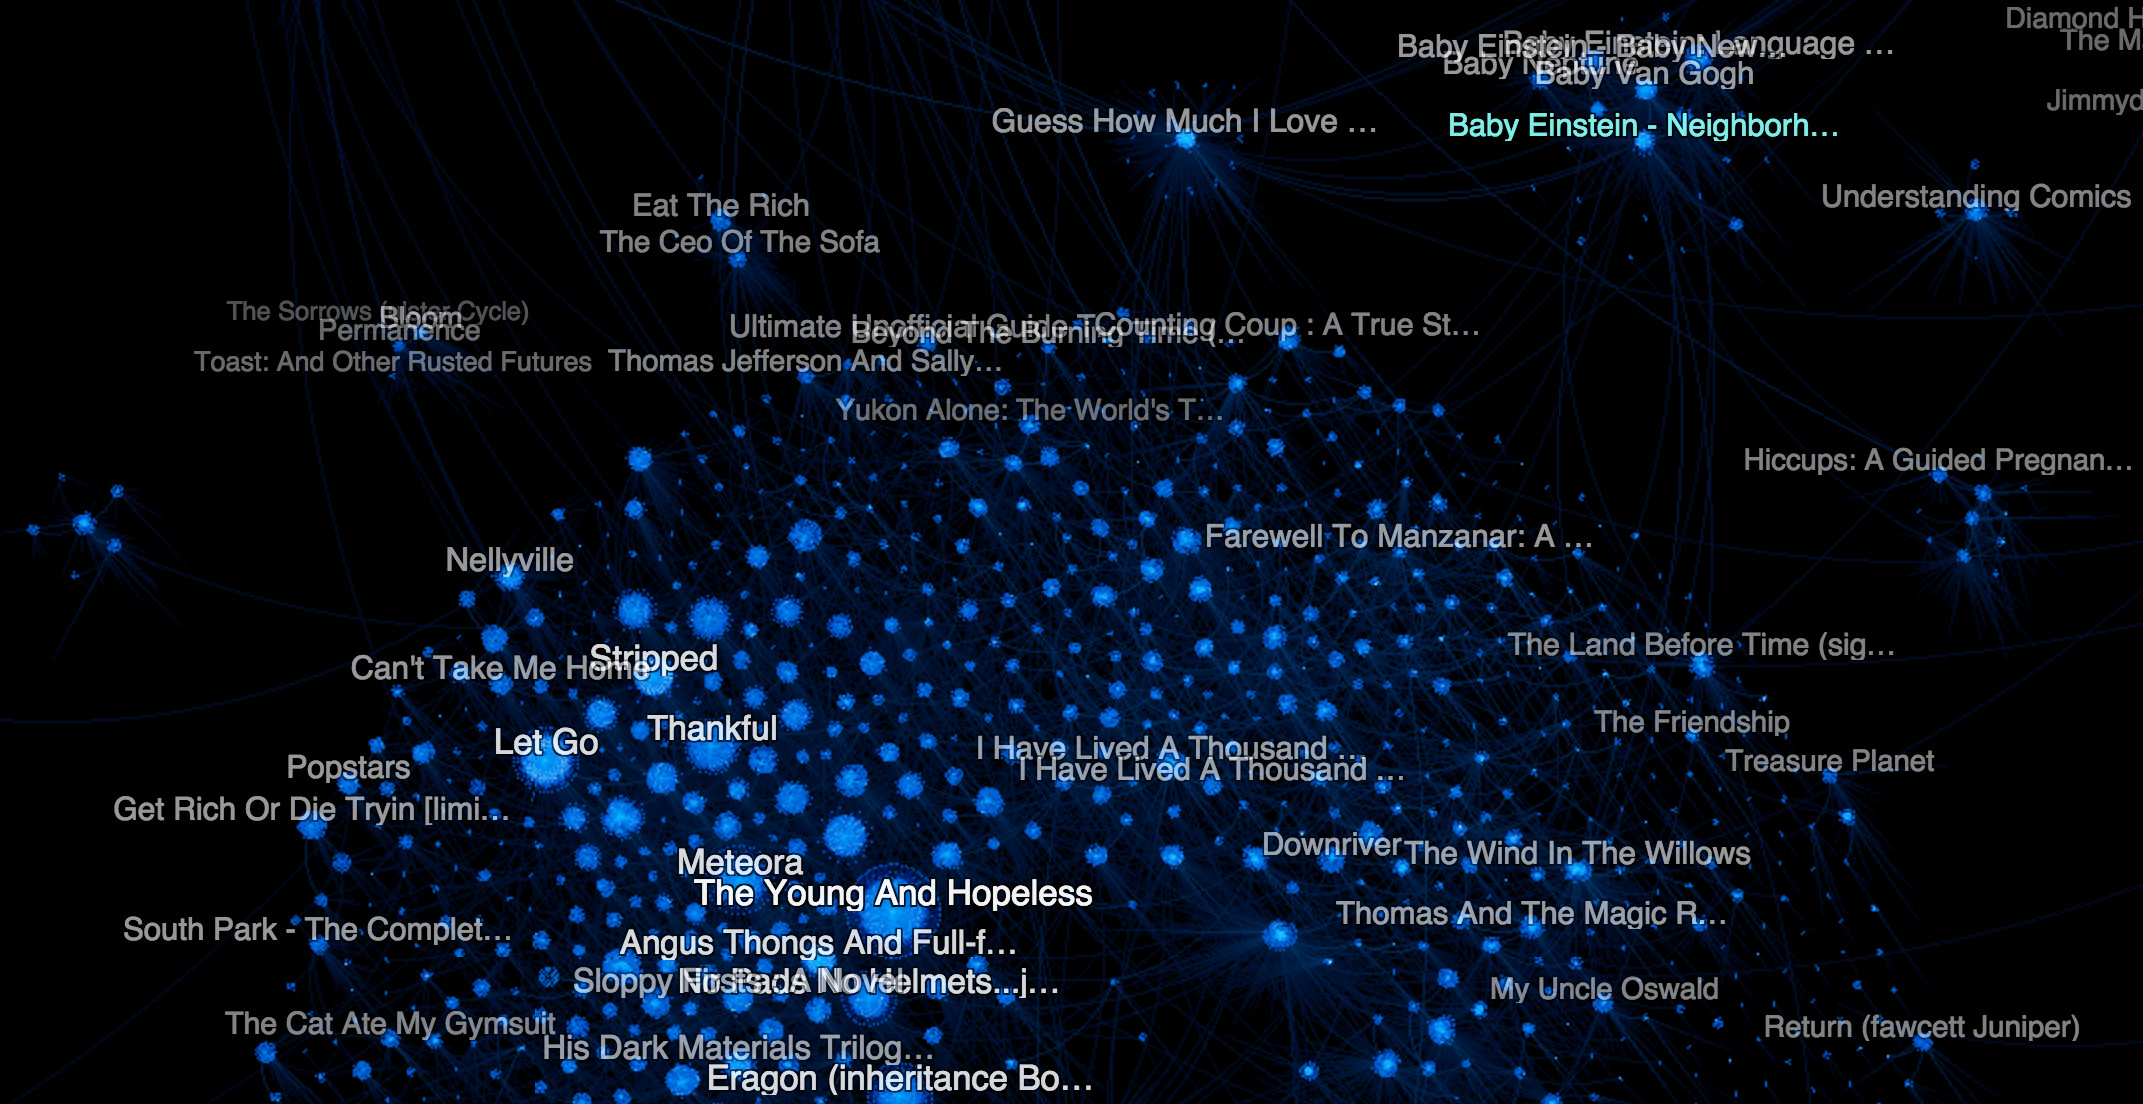
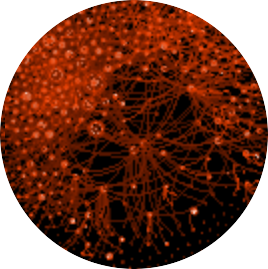
A graph of Amazon products and anonymized customers (> 2.3 million nodes) linked by weighted customer reviews and co-purchases (> 9.9 million links) suggests product affinity. Here, a collection of fantasy novels and alternative media may indicate the purchase habits of young adults.