Originally developed for an advanced research project, GeoTime is a powerful tool for visualizing and analyzing events across geography and time. Uncharted cultivated GeoTime in a nascent market into a suite of enterprise-class commercial products now used at major agencies in the U.S. and around the globe. GeoTime was acquired by PenLink in 2022 and is continuing its innovative journey to reach and serve an even greater audience.
Industry
Government
From secure environments to open data initiatives, research to operational deployment, we have extensive experience working in all sectors of government domestically and abroad.

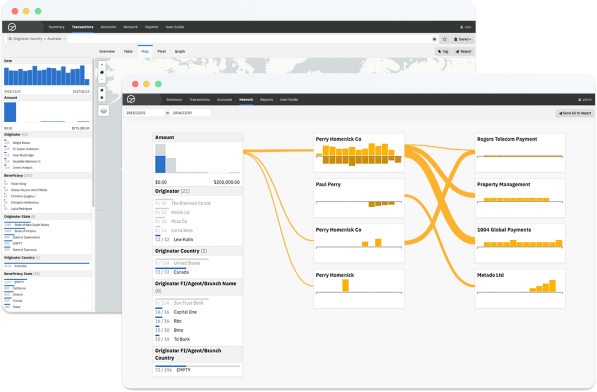
Influent - Follow the Money
Influent® is a fresh approach to link analysis for graphs of transactional data. Influent empowers analysts to visually and interactively investigate transactional flow between billions of entities, accounts and transactions, revealing actors and behaviors of concern.
Learn More-
-
International Crisis Management with Scalable Analytic Layered Tiles
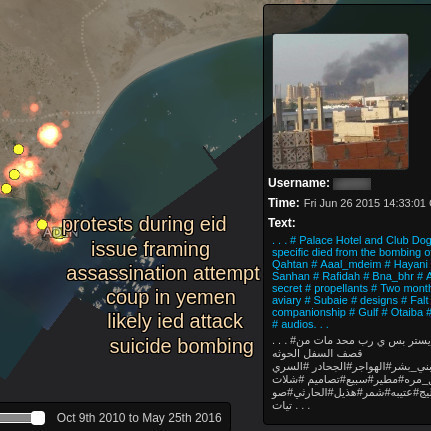
Interactive tile-based visual analytics that fuse diverse media sources and commercially available satellite imagery can aid investigation of events in many domains such as natural disasters, infrastructure changes or yields of global commodities.
In this proof-of-concept application, Uncharted combined numerous data sources and predictive analytics to improve discovery and corroboration of cease-fire violations in the Yemeni Civil War. Social media analytics flag possible indicators of military conflict. Adaptive macro-to-micro visualization, per-region topic summarization and interactive navigation point to both developing crises corroborated by underlying reports of violence. Frequently refreshed satellite imagery reveals evidence such as building destruction to support eyewitness accounts.
-
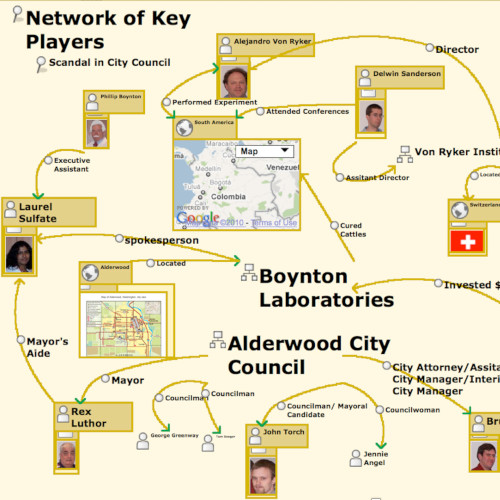
Navigating the Patent Universe with Graph Mapping
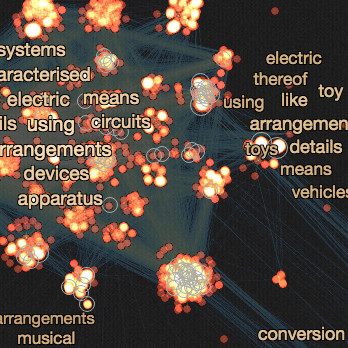
Making sense of the universe of relationships in massive data has been a longstanding challenge. The scalability limits of traditional node-link visualizations result in uninterpretable “hairballs.” New standard methodologies are needed to leverage the intuitive usability of geospatial maps for navigation and interpretation of multi-scale clusters and communities in data.
In this application of our novel graph mapping methodology, we built an interactive multi-scale map of all 2.5 million U.S. patents granted since 2001, linked by citation reference. Large, closely situated communities indicate technological domains with significant innovation. Analytic overlays convey themes, emergent or declining technological trends, and areas of intensive intellectual property contention.
-
Urban Pattern-of-Life Analysis
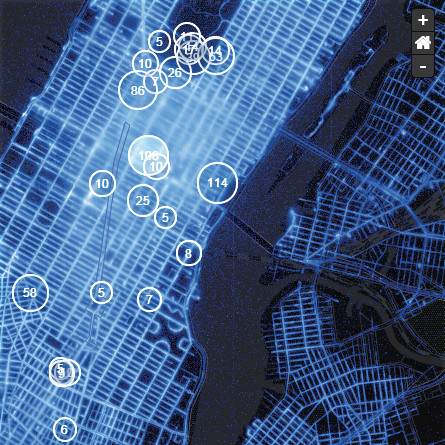
Modern cities are abundant sources of untapped pattern-of-life data that can help urban planners and investors understand land use and build complementary services. In this application, we used SALT to create an interactive multi-resolution map of taxi trip endpoints and openly available social media that reveals how people interact with urban spaces. Taxi traffic patterns and social media paint a picture of land use, cultural hotspots events and tourist activity. Spatial query-by-example tools empower planners to find areas similar to an indicated place of interest and better understand relationships between urban design and cultural behaviors.
-
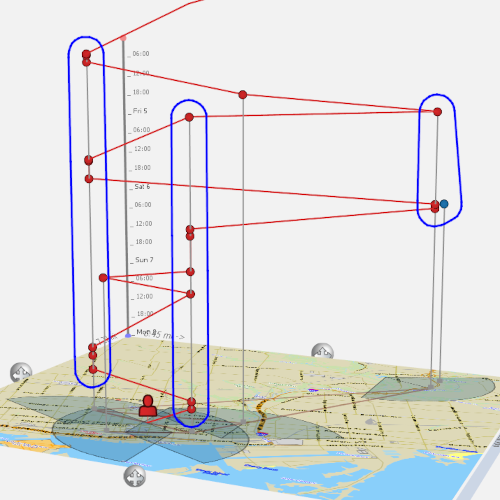
Maritime Security, Anomaly Detection and Predictive Movement
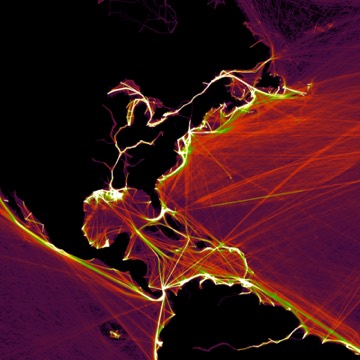
The maritime domain is awash with data vital to national security. Geotemporal ship movement visualization unlocks patterns of life that aid characterization of unusual events. Combined with predictive analytics, our tile-based visual analytics approach enhances human cognition to find anomalies. Overlooked behavior such as an unlikely meeting of fishing boats outside commercial zones could signal covert trafficking operations. For bulk carriers and tankers, a deviation in course from heavily traveled routes can signal a change in destination, which may be a leading indicator of inventory constraints or price movement in global commodities.
-
Explaining Complex Systems and Predictions
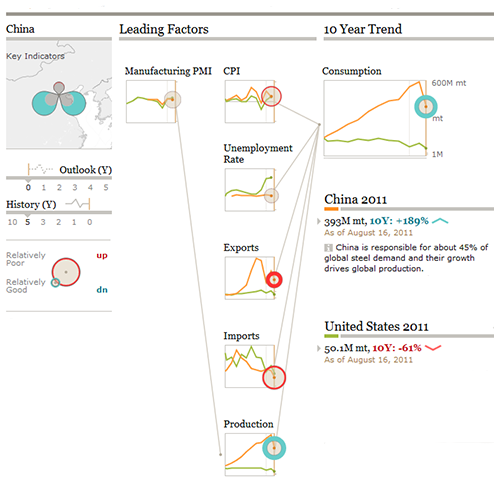
Autogenerated, interactive, story-driven visualization speaks to a wider audience and promotes deeper understanding of patterns and anomalies in data. Narrative sequences communicate observations, enabling a community to understand, to see for themselves, and to contribute. In this application story threads emerge as the user interactively drills-down to explore deeper underlying factors and scenarios. Unlike paper reports, live graphic presentations are up-to-date with the latest data and commentary.
-
Pioneering Visual Analytics with nSpace
A post 9/11, pre-HTML5 precursor to TellFinder, Uncharted’s nSpace is a landmark web-based visual analytics platform that enables analysts to interactively discover and synthesize insights from vast amounts of structured and unstructured data. nSpace includes semantic extraction and categorization, hypothesis exploration and evidence gathering, reasoning, collaboration and reporting. It is a collaborative environment to build and share knowledge. Powerful software agents combined with gesture-based data-driven sketching techniques are used to synthesize and share actionable knowledge with others.
nSpace in a web browser lets me integrate all of my analysis into a flexible thinking workspace. - Government Analyst
-
Navigating Conflict with MobileTerrain
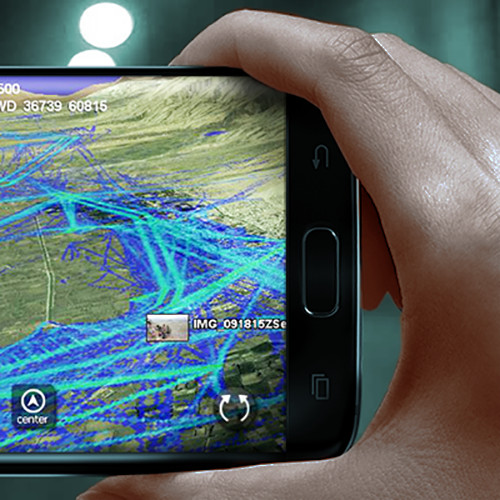
MobileTerrain™ is a next generation C2ISR solution for mission-critical data collaboration in real time. Cross-platform (Windows/Android/Linux) and designed for desktop, vehicle, tablet and dismounted handheld operation, MobileTerrain provides one solution for all tactical information where low bandwidth and disconnected operability are needed across the battlespace.
“Geo-chat,” C2 messaging, planning tools, vehicle integration, camera feeds and more are built-in and easy to use with little training required. MobileTerrain’s extensible, componentized SDK enables rapid development and integration of new capabilities.
-
Mission Critical Awareness, Planning and Execution
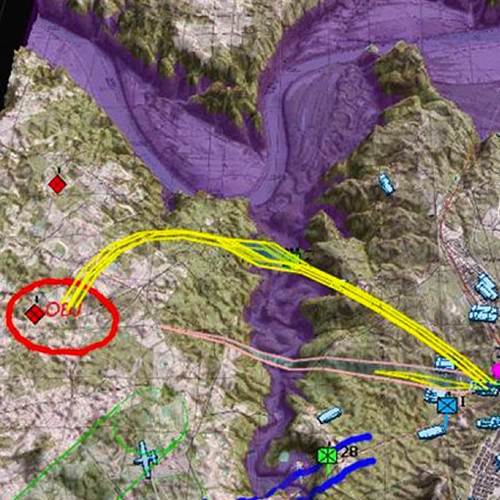
Real-time visualization provides commanders with the necessary tools for rapid assessment and comprehension of highly complex situations. Staying inside the opposition’s awareness / planning / decision cycle is essential when the ultimate goal is concurrent planning and execution. Interactive visual collaboration enables participants to work together remotely with shared understanding to plan next steps more rapidly and successfully. Uncharted develops and supports C2 collaboration solutions that are deployed and used around the world every day.
-
Airspace Management - Extreme Real-Time Performance
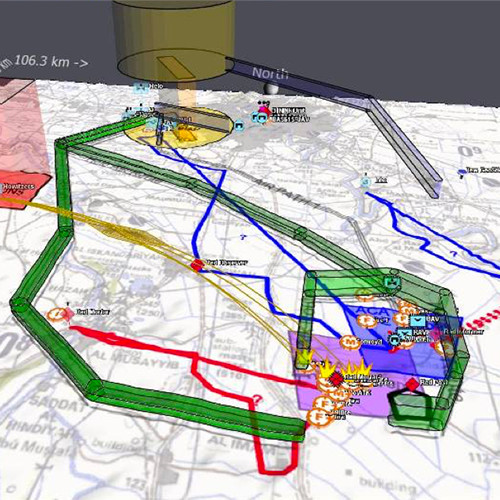
Uncharted provides interactive 2D and 3D visualization of complex airspace control measures, planned and actual mission routing, objectives and alert analytics that meets real-world performance and throughput requirements. Independent evaluations prove that Uncharted outperforms other legacy and incumbent solutions in terms of display, usability and cognitive performance.